In this article 
View / Download
pdf version of this article
Two previous articles in this series have outlined the main issues related to antimicrobial resistance within the community
in New Zealand (BPJ 30, BPJ
31). This article will review the data we have available now. This enables interventions to be targeted towards issues
which are local and current.
Contributed by Dr Rosemary Ikram, Clinical Microbiologist, MedLab South
Bacterial resistance in the New Zealand community
Surveillance of antimicrobial resistance is currently co-ordinated through the Institute of Environmental Science and
Research (ESR) and reports are made available on its website. The following organisms will be discussed in more detail:
methicillin resistant Staphylococcus aureus (MRSA), extended spectrum β-lactamase producing Enterbacteriaceae
(ESBL-E), Streptococcus pneumoniae (S.pneumoniae), Neisseria gonorrhoeae (N. gonorrhoeae)
and Haemophilus influenzae (H.influenzae).
MRSA
Initially this organism was detected mainly in hospitals as a result of healthcare associated infection (HA-MRSA). Strains
of MRSA more closely associated with community acquisition (CA-MRSA) have now been recognised. An epidemic MRSA (EMRSA)
first emerged in New Zealand hospitals in 2000. This strain was imported from the United Kingdom most likely by both patients
and staff.
The situation as it was at the end of 2009 is shown in Figure 1 and the distribution of strains among DHBs is shown
in Figure 2. EMRSA-15 is a healthcare associated infection, but the other named types (WSPP and AK3 MRSA) are community
acquired. This data suggests that the amount of EMRSA-15 is decreasing, however, the number of community strains is increasing.
This pattern of change is similar to that experienced in other countries.
| Figure 1: MRSA point-prevalence rates, 2000-2009, showing 95% confidence intervals (ESR data)1 |
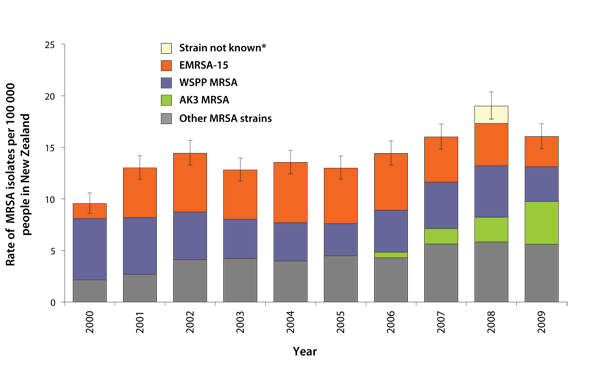 |
*The category “Strain not known” for 2008 represents the number of people identified
with MRSA by Middlemore Hospital laboratory which did not refer the isolates to ESR for strain identification.
|
| Figure 2: Point-prevalence rates of MRSA by district health board, 2009, showing 95% confidence
intervals (ESR data).1 |
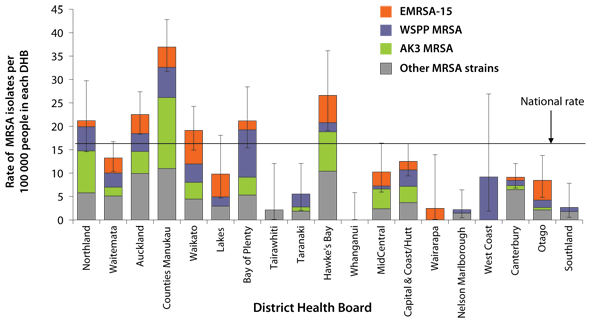 |
| N.B Data for the Capital & Coast and Hutt District Health Boards (DHBs) is combined as “Capital & Coast/Hutt”,
and data for the Canterbury and South Canterbury DHBs is combined as “Canterbury”. |
ESBL-E
ESBL-E produce a β-lactamase that renders them resistant to all penicillins and cephalosporins. Many of these organisms
are resistant to other groups of antimicrobials as well and are classified as multi-drug resistant organisms, i.e. resistant
to three or more classes of antimicrobial.
Figure 3 shows the annual/annualised incidence of ESBL-E from 2000 to 2009, demonstrating a rapid increase in isolates
since the beginning of the decade. Figure 4 shows the annualised incidence of ESBL-E-producing infections by DHB in 2009.
This distribution shows that more infections are encountered in the North Island compared with the South Island. Community
onset was assigned for 36% of these infections.
N.B. In the ESR data, healthcare-associated infection includes samples referred from emergency departments, outpatient
clinics or residential care facilities.
| Figure 3: Annual/annualised incidence of ESBL-producing Enterobacteriaceae, 2000-2009 (ESR data).2 |
 |
Figure 4: Annualised incidence of ESBL-producing Enterobacteriaceae infections by district health board,
2009 (ESR data).2 |
 |
Streptococcus pneumoniae
In 2008 a survey of community isolates of S.pneumoniae was performed to provide baseline serotype and susceptibility
data on community isolates, prior to the addition of the 7-valent conjugate vaccine (PCV-7), Prevenar, to the vaccination
schedule. Isolates were collected by two community laboratories - Diagnostic Medlab in Auckland and MedLab South in Christchurch.
Overall 17% of isolates were resistant to penicillin and 13.8% were resistant to penicillin and erythromycin. A total
of 12.7% were multidrug resistant. The only difference in the prevalence of susceptibility between Auckland and Christchurch
was the susceptibility to chloramphenicol which was 4% in Christchurch isolates and 0.7% in Auckland. With the introduction
of the PCV-7 vaccination programme, it would be expected that S.pneumoniae will be more susceptible because most
of the resistant serotypes are present in the vaccine.
Neisseria gonorrhoeae
Regular surveillance reports on the susceptibility of N.gonorrhoeae started in 2005. Since that time, ciprofloxacin
resistance has increased from 15% to 25% (2008 data). However, there is considerable local variation in susceptibility
in smaller centres. For example, in an outbreak of infection in South Canterbury over the December to January period 2009/2010,
none of the isolates were susceptible to ciprofloxacin.
The rate of penicillin resistance has remained relatively low although intermediate susceptibility to penicillin rose
from 55% in 2005 to 81% in the April to June quarter in 2008. Currently no ceftriaxone resistant isolates have been found.
Haemophilus influenzae
The susceptibility of invasive strains of H.influenzae has been monitored since 2000. On an annual basis, relatively
small numbers of organisms have been tested. The proportion of organisms which were ampicillin resistant by virtue of
β lactamase production has varied from about 11% to 34%. Latest data from 2009 showed resistance at 17.2%.
Another type of ampicillin resistance is β-lactamase negative ampicillin resistance (BLNAR). This was uncommon before
2005, but now accounts for approximately half of the ampicillin resistant isolates. In 2008, of the reported non-invasive
isolates, 24.7% were ampicillin resistant and 3.7% amoxicillin clavulanate resistant. These latter isolates represent
the BLNAR H.influenzae, therefore this type of resistance seems to be less common in less invasive organisms.
Antimicrobial use in New Zealand
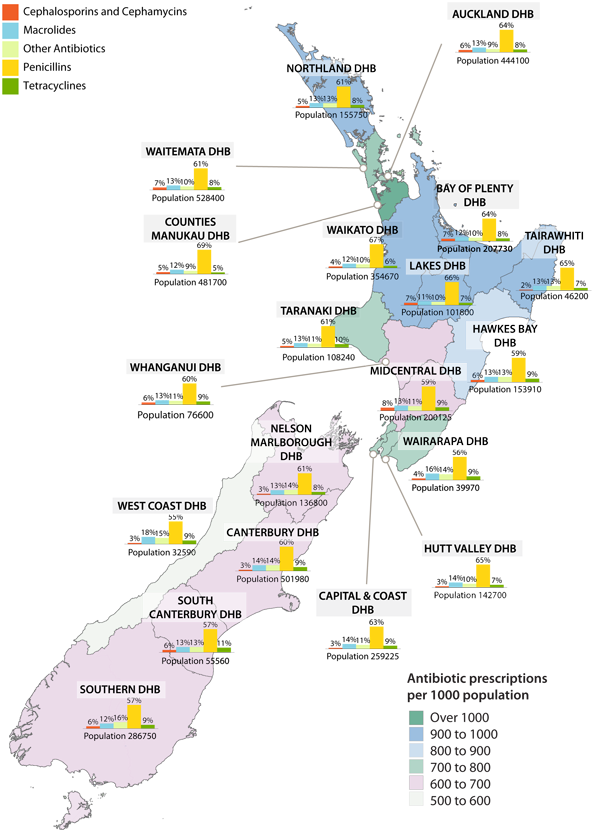
There is some variability in the number and type of antibiotics dispensed around New Zealand. Figure 5 shows the number
of antibiotic prescriptions dispensed per 1000 population, by DHB area (indicated by different colour shading on the map).
Bar charts show the percentage of these antibiotics by antimicrobial group. Figure 5 shows less antimicrobial scripts
per 1000 population in the South Island compared to the North Island. This mirrors surveillance data from Europe, which
shows that in general there is less antimicrobial resistance in areas where less antimicrobials are used.
Figure 5: Antibiotic prescriptions dispensed per 1000 population, 2009.
A portrait of antimicrobial resistance
The surveillance information from ESR, along with patterns of antimicrobial use, highlights the current problem of antimicrobial
resistance in New Zealand. This situation has changed, and will continue to change, over time. Infectious organisms are
imported to this country and then spread, often in the healthcare setting first, before becoming established in the community.
Reducing the use of antimicrobials has been shown to reduce the occurrence of these organisms overseas and this may well
be the case in New Zealand too.
References
- Richardson A, Pope C, Couper J, et al. Annual survey of methicillin-resistant Staphylococcus aureus (MRSA). ESR;
2009.
- Heffernan H, Woodhouse R. Annual survey of extended-spectrum beta-lactamase (ESBL)-producing Enterobacteriaceae.
ESR; 2009.