In this article 
View / Download
pdf version of this article
A brief history of the Programme
The PHO Performance Management Programme, later renamed the PHO Performance Programme (PPP), was established in 2005
as a voluntary programme, in response to reports from the Clinical Performance Indicator Project (2005) and Referred Services
Group (2002). The main aim of the Programme is to improve the health of enrolled populations and reduce inequalities in
health outcomes through supporting clinical governance and rewarding quality improvement within PHOs.
The Programme has had a number of successes in its six years. Key highlights include:
- Improved performance against targeted indicators
- Reduced health inequalities
- Established strong governance arrangements including provider representation
- Evidence of the effectiveness of primary care
- Improved data for quality improvement, policy development and planning
- Alignment with other performance measures to minimise the collection burden on primary care
These successes have been achieved through hard work and good sector engagement, but this was not always an easy path.
The initial set of Programme indicators were developed by a PHO Clinical Performance Advisory Group and a joint DHB/Ministry
of Health project team, with guidance from a Referred Services Management Expert Steering Group. The first pre-requisite
phase began in July 2005 and the first six monthly performance periods began on 1 January 2006, with 29 PHOs participating.
Despite some initial criticisms, participation in the Programme continued to grow and by July 2007 all of the then 82
PHOs had joined.
A new governance structure for the PPP was introduced in 2008, involving provider, PHO, DHB and Ministry of Health representatives.
This Governance Group still exists today and has provided strong leadership and guidance for the Programme to ensure it
continues to add significant value to the sector. The Governance Group is supported by the Programme Advisory Group, which
provides expert advice on the content of the Programme and ensures clinical relevance and evidence base as well as considering
implementation options, policy priorities and alignment and business sustainability.
Under these governance arrangements the Programme has matured and it now places a greater emphasis on quality improvement.
This is achieved via a step-wise approach, starting with recording, then moving on to activities and finally on to patient
outcomes. An example of this is the management of patients with diabetes. Measures currently exist to record a diagnosis
of diabetes and to actively manage patients who have been detected through regular reviews. Now a third phase measurement
is being considered to assess how well these patients are responding to their management. Once recording is well established,
it is planned that these indicators will cease to be funded directly, but will transition to qualifying criteria for payment
of incentives for the management of patients with diabetes.
The continuous improvement approach is supported by a number of incentive mechanisms. Incentive payments are distributed
based on the rate of progress being made rather that just absolute performance against the target agreed between the PHO
and the DHB. This mechanism recognises that PHOs serve diverse populations with different needs and a one size fits all
approach, based on nationally consistent targets, could lead to the undesirable situation where PHOs serving the highest
need communities with the most difficult to reach populations would receive the smallest incentive payments.
The reduction of health inequalities also remains an important objective. This is recognised in the incentive payments
structure where a higher payment is given to PHOs for successful improvement in the higher need population. For the purpose
of the Programme, the high need population is defined as; people who are of Māori or Pacific ethnicity or who live
in the most deprived quintile areas.
Other incentive mechanisms include the development of business intelligence tools for the PHOs and the distribution
of information in ways that are useful for PHOs (and their practices) and DHBs to inform improvement.
Has the Programme delivered value?
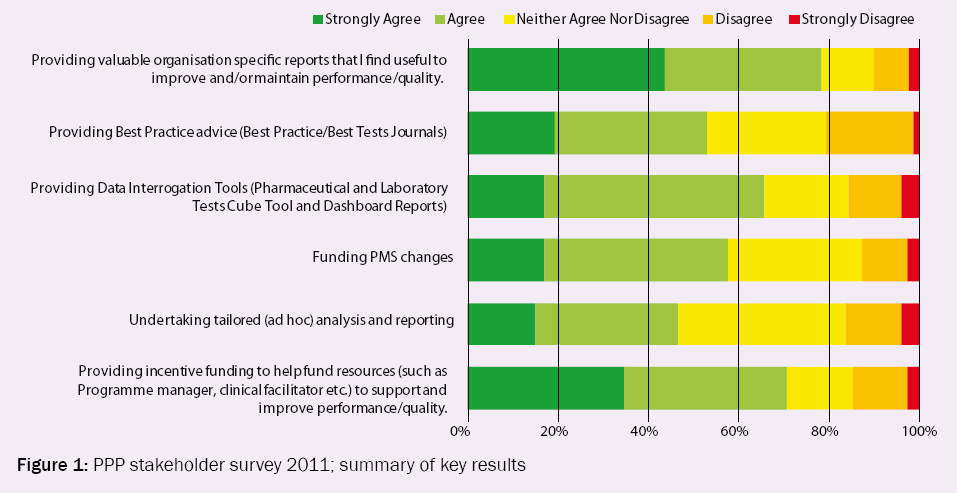
Earlier this year the Programme surveyed its stakeholders to assess its value. Whilst this survey only received 90 responses
these were well distributed among Providers, PHOs and DHBs. Figure 1 illustrates that overall, most respondents found
the Programme to be valuable.
Figure 1: PPP stakeholder survey 2011; summary of key results
How has the Programme measured up?
The Programme has now been running for approximately six years and for many Programme indicators there is sufficient
history to identify whether improvements have been made in the target populations.
Whilst it could be argued that some of the improvements reported are merely down to better recording of activity that
was already being undertaken in General Practice before the Programme was established, it is also true that systematic
recording and measurement is an element of a quality system.
“We can only be sure to improve what we can actually measure”.
– Lord Darzi, Next Stage Review report, NHS, 2008
As with any other complex system it is sometimes difficult to isolate the success of the Programme from other factors
influencing performance.
With these caveats the performance against some of the key indicators covering health priority areas are examined as
follows.
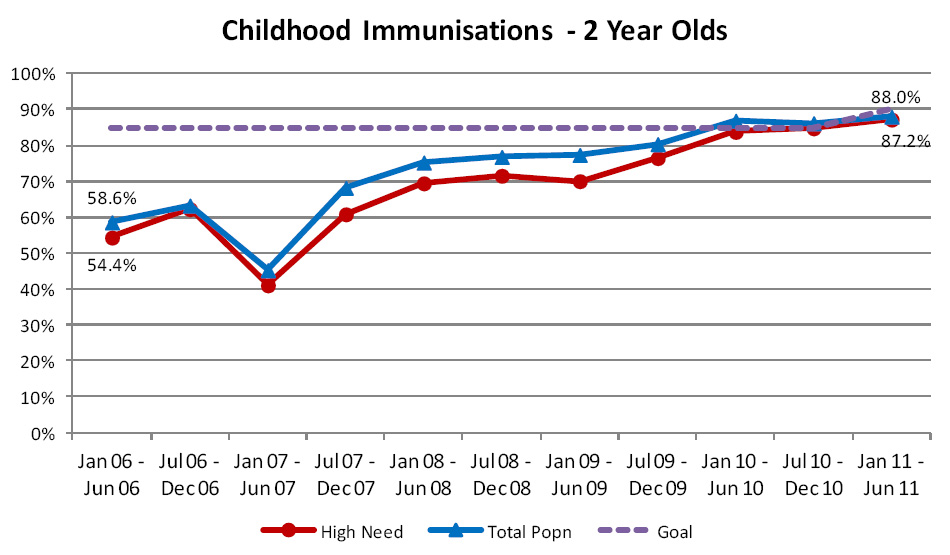
Age appropriate vaccination for two-year-olds
This indicator was originally measured using data derived directly from primary care and counted the proportion of enrolled
two-year-old children recorded as being fully immunised. Following discussions with PHOs and extensive patient-by-patient
analyses proving the reliability of the national immunisation register (NIR), this indicator was transitioned to using
the NIR as the data source by 1 January 2011. Now this indicator measures the percentage of children aged two years who
have received the complete set of final dose age appropriate vaccinations. The number of fully vaccinated children is
compared with the number of children on the enrolment register who turned age two years during the period, even if they
are not recorded on the NIR. For this reason the Programme usually reports slightly lower rates of immunisations than
are quoted for DHBs in the Health Target where only children recorded on the NIR are reported.
The Programme goal was originally set at 85% but has recently been raised to 90%, and will further increase to 95% in
2012, to maintain alignment with the Health Target.
Since this indicator was first funded in October 2007 PHOs have continued to improve their performance. The current
rate of immunisation in two-year-olds is 87.2% amongst the high need population and 88.0% for the total population (Figure
2). The gap between the rates achieved for the high need population and the total population continues to close and is
now just 0.8%.
| Figure 2: Percentage of children aged two years, enrolled in a general practice in New Zealand,
who have been fully immunised |
 |
Breast cancer screening
Originally this indicator measured the percentage of women aged 50 to 64 years who had a mammogram as part of the national
breast screening programme (BreastScreen Aotearoa), within the last two years. In January 2011 this age range was extended
to include women aged 65 to 69 years to reflect the current target population for the national breast screening programme.
This change has increased the reported figures for this indicator by 0.4% in the latest reporting period.
Only publicly funded mammography screenings performed by BreastScreen Aotearoa are counted by the Programme. True coverage
rates, which include private mammography screenings, are likely to be higher, particularly for the total population measure,
which is an information only indicator.
Breast cancer screening rates have improved steadily over the time period, with a 13% rise in rates recorded overall
and a 19% improvement in rates for the high need population – reducing reported health inequalities (Figure 3).
Provided current rates of improvement are maintained, the Programme goal of 70% coverage should be achieved for the high
need population group within the next two years.
| Figure 3: Percentage of women aged 50 to 64 years (50 to 69 years from 2011), enrolled in general
practice in New Zealand, who have been screened by the national breast screening programme within the last two years |
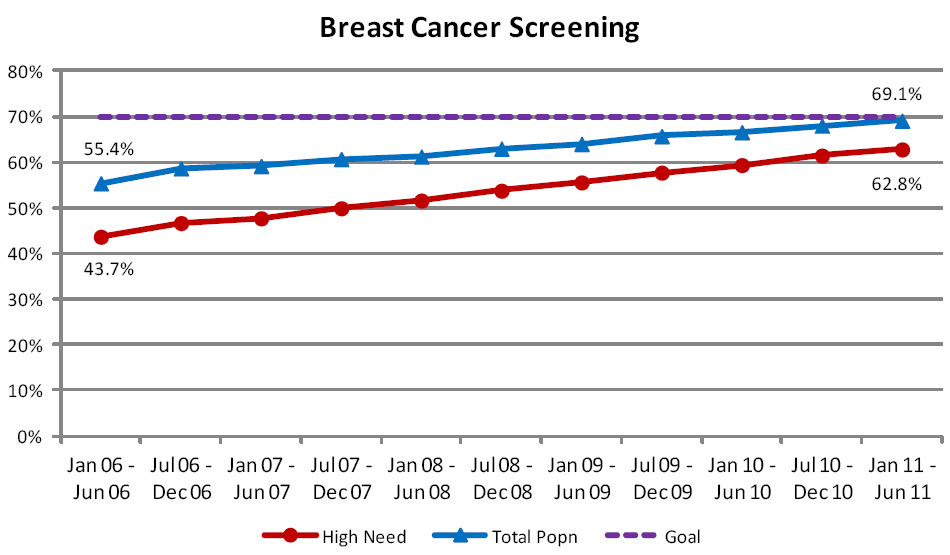 |
Cervical cancer screening
This indicator measures the percentage of women aged 20 to 69 years who have received a cervical screen within the past
three years. Data provided by the National Cervical Screening Programme is used to calculate this measure so women who
choose to opt off the National Screening Programme’s register will not be counted by the Programme, even if they
have had a cervical screen within the past three years. All figures are also adjusted at the national age related rate
to allow for women who have had a hysterectomy and do not require cervical screening.
Although progress has been made over the lifetime of the Programme and rates have risen by 5%, improvement has now slowed
and the national rate remains just below the Programme goal of 75% coverage (Figure 4). Progress has been slightly better
for the high need population and the gap between the two populations has now reduced to 8% from over 11%.
| Figure 4: Percentage of women aged 20 to 69 years, enrolled in general practice in New Zealand,
who have had a cervical screening test within the last three years |
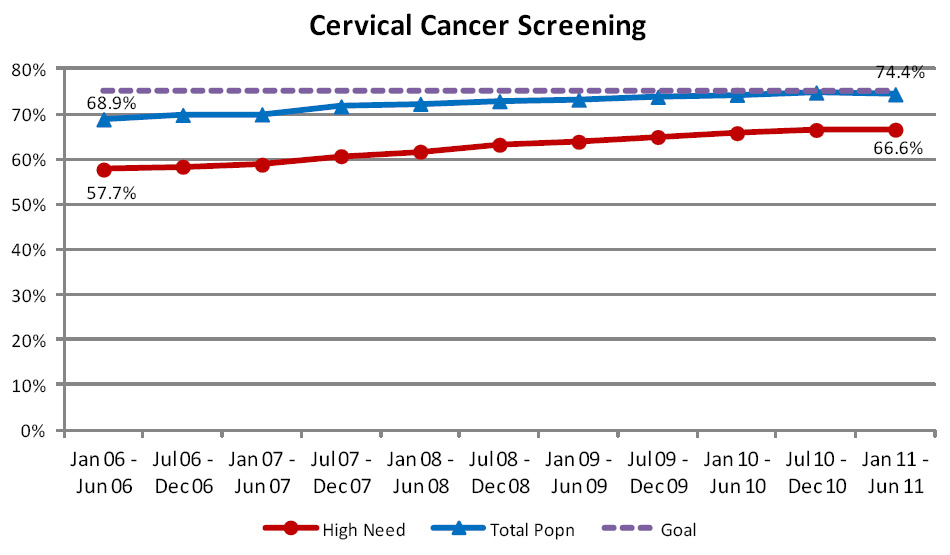 |
Ischaemic cardiovascular disease detection
This indicator measures ischaemic CVD diagnoses recorded in primary care against a national model of expected rates
for patients aged 30 to 79 years.
Prior to 2010 there were problems obtaining complete data for this indicator from primary care systems and collection
was limited to a subset of ischaemic heart disease. High levels of detection are now being reported, with all PHOs recording
detection rates in excess of prevalence estimates (Figure 5). Work is being conducted to understand why such high rates
are being reported and to ensure that, in the future, more realistic performance figures are produced by the Programme.
The number of patients being recorded with ischaemic CVD in primary care has risen steadily over the past three reporting
periods.
| Figure 5: Percentage of people, enrolled in general practice in New Zealand, who have been diagnosed
with ischaemic CVD |
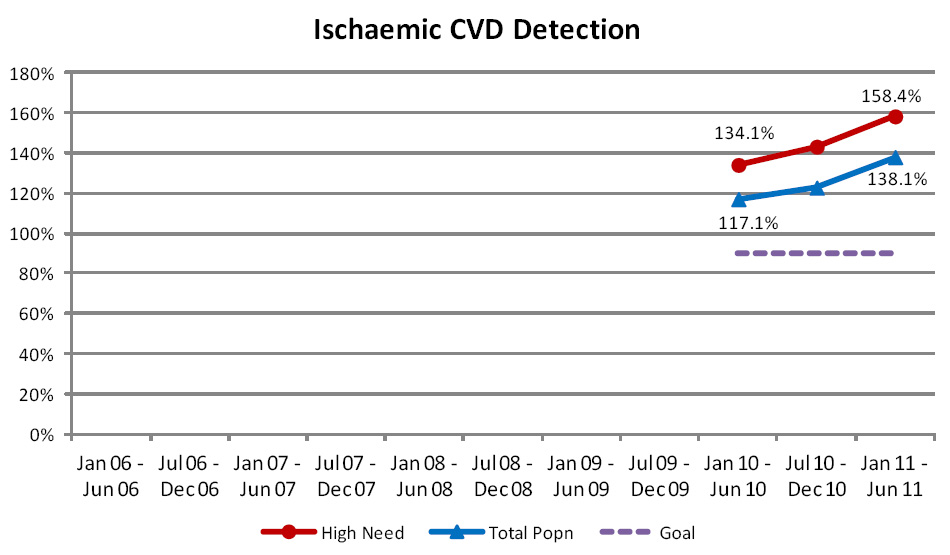 |
Cardiovascular risk assessment
This indicator measures the percentage of enrolled patients in the target population who have had their cardiovascular
risk recorded within the past five years. This indicator was introduced in 2008 with a Programme goal of 80% coverage
to be achieved within five years.
The target population for this indicator is:
- Males of Māori, Pacific or Indian sub-continent ethnicity aged 35 to 74 years
- Females of Māori, Pacific or Indian sub-continent ethnicity aged 45 to 74 years
- Males of any other ethnicity aged 45 to 74 years
- Females of any other ethnicity aged 55 to 74 years
Although the capture of CVD risk information has been occurring in primary care across the country for many years, this
indicator is relatively new to the Programme. Improvements continue to be made in the systematic recording of this information
within practice management systems and subsequent capture by the Programme. Currently the rate of CVD risk assessment
is well below the 80% Programme goal (Figure 6).
| Figure 6: Percentage of people in the target population, enrolled in general practice in New Zealand,
who have had a CVD risk assessment within the past five years |
 |
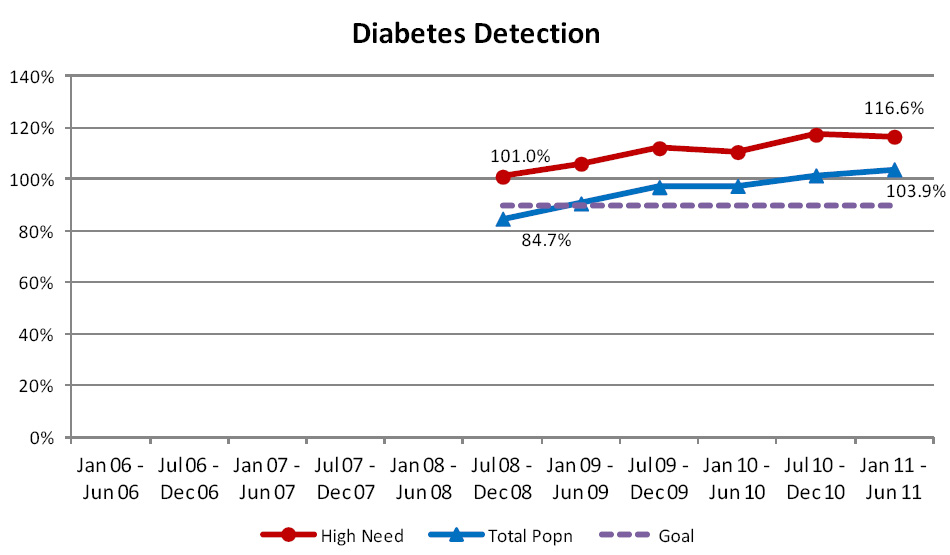
Diabetes Detection
The diabetes detection indicator compares the number of patients aged 15 to 79 years, recorded with a diagnosis of diabetes
in primary care, against a national model of expected rates of diabetes, based on indicators of disease taken from other
sources such as pharmaceuticals dispensed, laboratory tests ordered and hospital records.
Progress against this indicator is complicated by refinements made to the national diabetes prevalence model. In fact,
one of the successes of the Programme has been the refinement of the national prevalence model as a result of feedback
that primary care has been able to provide the diabetes team at the Ministry of Health. Despite these improvements, the
prevalence model continues to understate the number of people with diabetes, particularly amongst the Māori and Pacific
population. As a result, detection numbers exceed 100% (Figure 7).
Interestingly, a
recent report from the National Health System (NHS) in the United Kingdom found that 2.2% of patients classified
as having diabetes, did not actually have this condition. If this was also the case in New Zealand, it would provide
further explanation of the current Programme results.
| Figure 7: Percentage of people, enrolled in general practice in New Zealand, who have been diagnosed
with diabetes |
 |
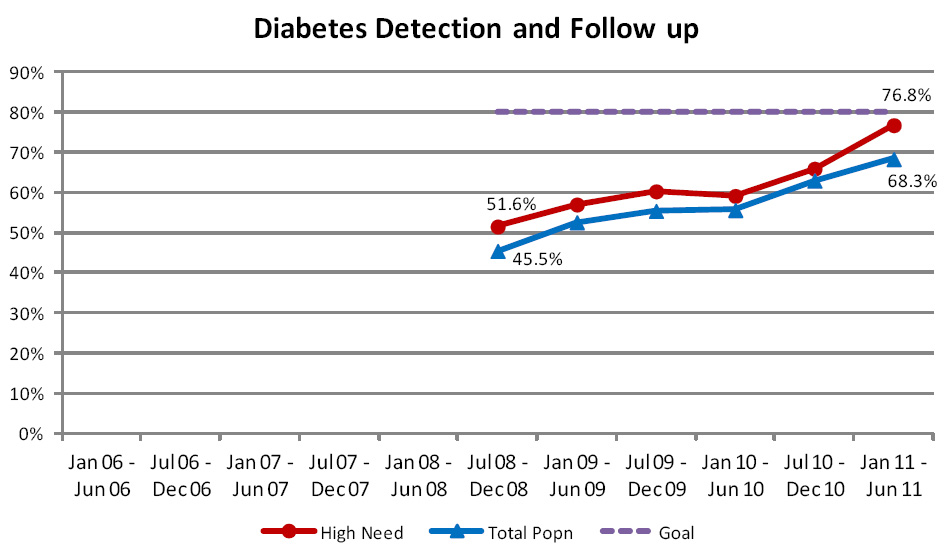
Diabetes Detection and Follow Up
This indicator measures the proportion of the population with diabetes, aged 15 to 79 years, who are receiving an appropriate
diabetes review at least annually. A diabetes review is expected to include the measurement of HbA1c, microalbuminuria
and lipids, review of cardiovascular risk, examination of the feet, retinal screening (every two years) and review and
updating of the patient’s care plan. The Programme goal is that at least 80% of this population should receive a
diabetes review each year.
Currently there are technical difficulties in collecting this data from PHOs who do not use the Get Checked Programme
to provide diabetes reviews; these difficulties are being addressed by the Programme on a case by case basis.
This indicator currently uses the national prevalence model as the denominator, rather than the number of patients identified
by primary care. Therefore, improved performance against this indicator partly reflects changes in the prevalence model
(Figure 8). When compared against the number of people with diabetes recorded by primary care, annual review rates have
risen from 51% to 65.8% (total population) and 53.6% to 65.9% (high need population) since July 2008. Some of this reported
increase reflects improvements being made in collecting this data via PHOs.
| Figure 8: Percentage of people with diabetes, aged 15 to 79 years, enrolled in general practice
in New Zealand, who have received an appropriate diabetes review at least annually |
 |
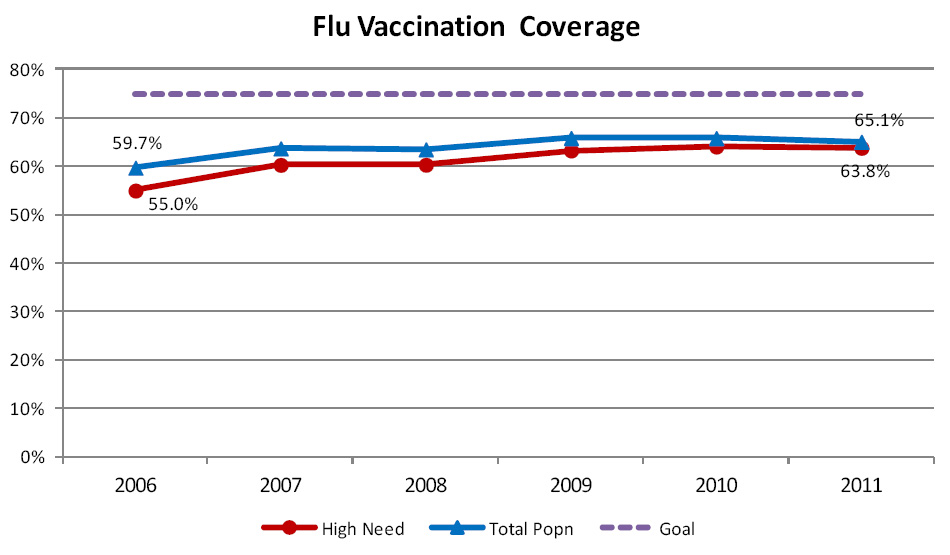
Seasonal influenza vaccination coverage
This indicator measures the rate at which patients aged over 65 years receive seasonal influenza vaccinations, each
year between January and June. This data is sourced from claims data rather than directly from primary care so patients
paying for their own vaccinations or where vaccinations are delivered outside a practice setting may not be counted.
Although some progress was made in the first few years of the Programme, additional progress has been slow for this
indicator since then and the coverage rate reported by the Programme remains 10% below the Programme Goal of 75% coverage
(Figure 9).
| Figure 9: Percentage of people aged over 65 years, enrolled in general practice in New Zealand,
who have received a seasonal influenza vaccination |
 |
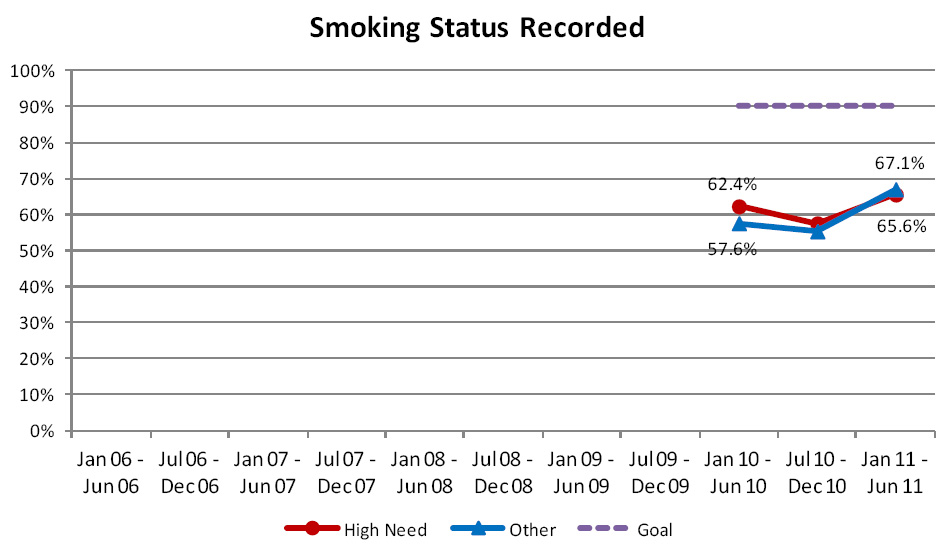
Smoking Status Recorded
This indicator measures the proportion of the enrolled population aged 15 to 74 years who have had their smoking status
recorded. The Programme goal is that smoking status will be recorded for at least 90% of the population. A minimum of
70% of this population must have their smoking status recorded before the PHO is eligible to receive incentive funding
for primary care to provide brief advice or cessation support. This applies to the performance period ending 31st December
2011 and in subsequent years.
This indicator is measured from data taken from practice management systems and provided to the Programme as a PHO aggregate.
This indicator was only introduced as a funded indicator from 1 January 2011 so it is too early to assess any significant
trends. Overall the results show an encouraging positive trend in performance, which has been most rapid for the high
need population group, typically resulting in more equitable performance between the population groups (Figure 10).
| Figure 10: Percentage of people, aged 15 to 74 years, enrolled in general practice in New Zealand,
who have had their smoking status recorded |
 |
Programme successes
The Programme has been instrumental in building a rich database of evidence of the work being done in primary health,
to improve the health of the population through immunisation, screening, health promotion and the management of longer-term
conditions. This is invaluable in helping inform policy and planning decisions around the future of health care.
The Programme has helped develop standards for the systematic recording of specific health information, and where necessary,
funding changes to practice management systems. This has led to improved data quality - debates about the quality of the
data are now more often about what the information is saying and how this can be used to inform better quality care. The
sector is now placing increasing demands on the Programme to deliver more detailed timely data.
The Programme is currently working with the Ministry of Health and other agencies to ensure, wherever possible, that
Programme indicators align with similar measures used elsewhere and, where practical, ensure that data collected by primary
care providers form the basis for primary care health targets.
The Programme also funds educational material for primary care including contributing to the funding of Best Practice
Journal and other bpacnz material.
Development plans
The Programme has been successful in establishing robust data flows for the recording of activity for health priority
areas. Further work is now required to evolve the indicators in these areas to focus more on health outcomes and the benefits
to patients and the community.
Some important areas of primary care activity need to be added to the Programme to provide a more diverse range of measures.
For example, work is currently underway to consider suitable indicators to measure and promote good primary mental health
care.
One of the criticisms of the Programme has been that the information provided is produced far too late and too remote
from primary care providers to be useful in changing behaviours and assisting effective management. This is currently
a major focus for the Programme team and reports are now being produced more promptly. Monthly reports are being created
for indicators, where the report can be produced without adding to the collection burden of PHOs and providers. This allows
progress to be tracked and actions taken within each reporting period.
The feasibility of providing prospective target lists, available at practice level for screening and immunisation activity,
is being considered. This would enable individual practices to readily identify the work they need to do to achieve targets.
Data quality remains a concern and recent validation work undertaken by the Programme has revealed a small number of
issues with PMS vendor implementations of the data extracts used by the Programme. Local variations in the means of delivering
or coding a service also continue to present problems for the Programme and these will continue to be addressed on a case-by-case
basis as the Programme becomes aware of them.
The merger of PHOs has created a number of challenges for the Programme with some of the new, larger organisations wishing
to report performance at a locality level. This is relatively simple for indicators reported from national collections,
such as immunisation and screening activity, that are available at patient level. However, the task is far more difficult
for indicators derived from practice management systems since the Programme has traditionally only received PHO level
aggregates to meet the concerns around patient privacy. Local arrangements are being made with these PHOs to receive more
detailed information that can then be reported at a locality level. The Programme is proposing to strengthen its processes
to ensure that this can be achieved without compromising patient privacy.
Patient level information has also proved useful in the past, in helping to improve the quality of the data received
by the Programme. This provides a useful audit trail that is currently absent from the PHO aggregate data received by
the Programme.
The other big challenge to the Programme will be to embrace the multidisciplinary team approach to patient care and
ensure that it does not create new blind spots in the collection of data. Perhaps General Practitioners, as co-ordinators
of care for their patients, will continue to remain the best place to seek this information, but the Programme will need
to remain alert.
Final thoughts
The Programme has developed, and maintains, a rich source of data describing primary care activity and the health of
the enrolled population. This is useful to policy makers, planners and funders and provides comparative data that can
be used by PHOs and providers to identify opportunities for quality improvement. Overall, progress in recorded performance
has been made across all currently funded indicators since they were first introduced to the Programme, although some
indicators create significant challenges if the Programme Goals are to be achieved. Perhaps most importantly the Programme
has raised the visibility of the activities of primary care in helping to keep New Zealanders healthy and narrowing the
gap between high need populations and the rest of the country.
 For further information about the PHO Performance Programme, including membership
of the Advisory and Governance groups, visit: www.dhbnz.org.nz/Site/SIG/pho/Default.aspx
For further information about the PHO Performance Programme, including membership
of the Advisory and Governance groups, visit: www.dhbnz.org.nz/Site/SIG/pho/Default.aspx
ACKNOWLEDGEMENT Thank you to Stewart Pye, Senior Analyst, National Services
and Primary Health Performance, DHB Shared Services and colleagues for contributing this article.