In this report 
View / Download pdf version of this report
Welcome to your annual practice report
This report has been developed to give you an opportunity to reflect on the treatment received by patients registered at your practice in the past year. It summarises the medicines dispensed and laboratory tests requested for those patients between July 2011 and June 2012.
What is different about this report compared with previous years?
- It includes data on all subsidised medicines dispensed and laboratory tests requested for your registered patients.
- It describes the demographics of your registered patient population, including patients who were not prescribed medicines or did not receive any laboratory tests.
- It includes adjusted data that takes into consideration any demographic differences between your practice population and others in New Zealand.
- It includes medicines prescribed to your patients by health professionals who do not work in your practice, which may include hospital doctors or private specialists.
- In the tables at the end of this report you will be able to compare the number of dispensed medicines and laboratory tests per 1000
registered patients at your practice to the number per 1000 registered patients in New Zealand.
Why were the reports changed?
Our reports have been changed to provide more accurate feedback on the care your patients receive. Many practitioners may not be aware of the extent to which other health providers prescribe and request laboratory tests for their patients. In this report, all of the medicines and laboratory tests your patients received are presented.
 Quick facts for Sample Practice
Between July 2011 and June 2012
| Number of health providers who have prescribed medicine to your registered patients |
780 |
| Number of health providers who have requested tests for your registered patients |
316 |
| Total cost of subsidised dispensed medicines for you registered patients |
$794,887.80 |
| Percent of registered patients dispensed at least one medicine |
75% |
| Total number of laboratory tests requested for your registered patients |
22,301 |
| Percent of registered patients with at least one test in a community laboratory |
50% |
Comparing the care received by your patients
How do the medicines dispensed and laboratory tests requested for the registered patients at your practice differ from other New Zealand practices?
To answer this question, the data below have been adjusted to account for the major differences in practice populations: age, sex, ethnicity, deprivation; and for medicines dispensed, therapeutic group to account for morbidity.
This gives the ratio between the medicines and tests your patients received, and what would be expected if there were no differences in the underlying population between them and any other New Zealand practice.
For pharmaceuticals, cost has been adjusted, because this takes into account the number of dispensings, quantity, strength and formulation of medicines. For laboratory tests, number of tests has been adjusted, because laboratories are bulk funded and the actual cost of tests is not readily available.
 For more information about indirect standardisation see:
www.indicators.scot.nhs.uk/TrendsJuly09/Standard.htm
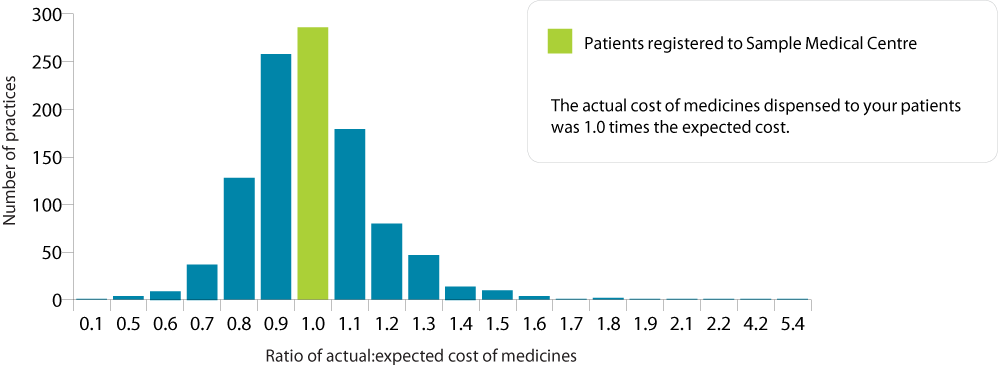
Distribution of practices by actual:expected cost of dispensed medicines
Where does your practice's population fall in the distribution? If the ratio is high or low your patients may not be
receiving similar levels of prescribing to patients registered at other similar practices. (click on image to enlarge)
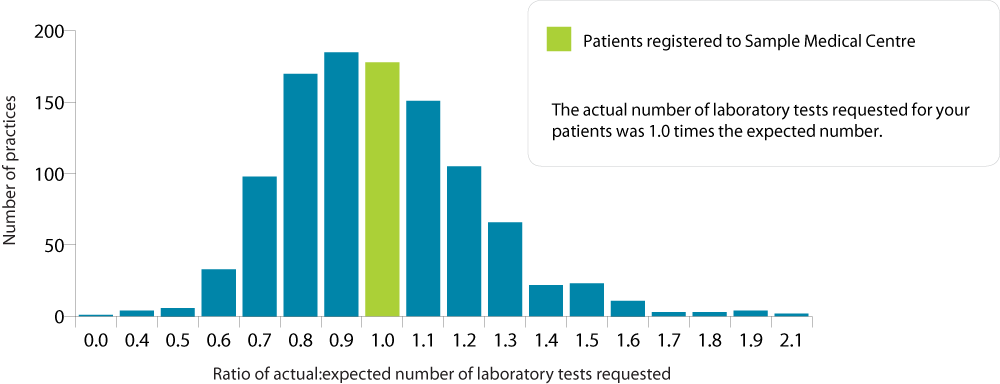
Distribution of practices by actual:expected number of laboratory tests
Where does your practice's population fall in the distribution? If the ratio is high or low your patients may not be
receiving similar rates of testing to patients at other similar practices. (click on image to enlarge)
Demographics of your registered patients
This section describes the demographic characteristics of the registered population of your practice, compared to the demographics of all
registered patients in New Zealand. The data in this section is taken from the first quarter 2012 enrolment registers
provided to bpacnz by the Ministry of Health.
| Patients registered to your practice |
3500 |
| Mean number of registered patients per practice in New Zealand |
3900 |
Gender

Age group
This is based on the recorded date of birth for each patient. The age bands are uneven because children aged under
five have specific clinical needs and this is a population where individual practices may differ significantly from the average population.

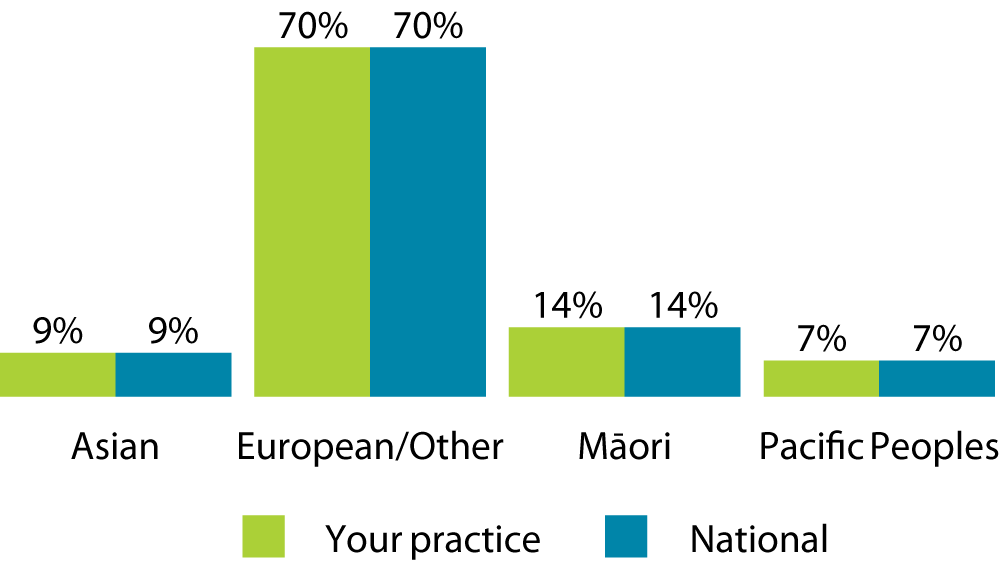
Ethnic group
This is based on the patient's self-identified ethnic group. A patient may specify up to three ethnic groups which are
then prioritised: if any of the three ethnic groups is Maori or Pacific Peoples, the patient is identified in this group.
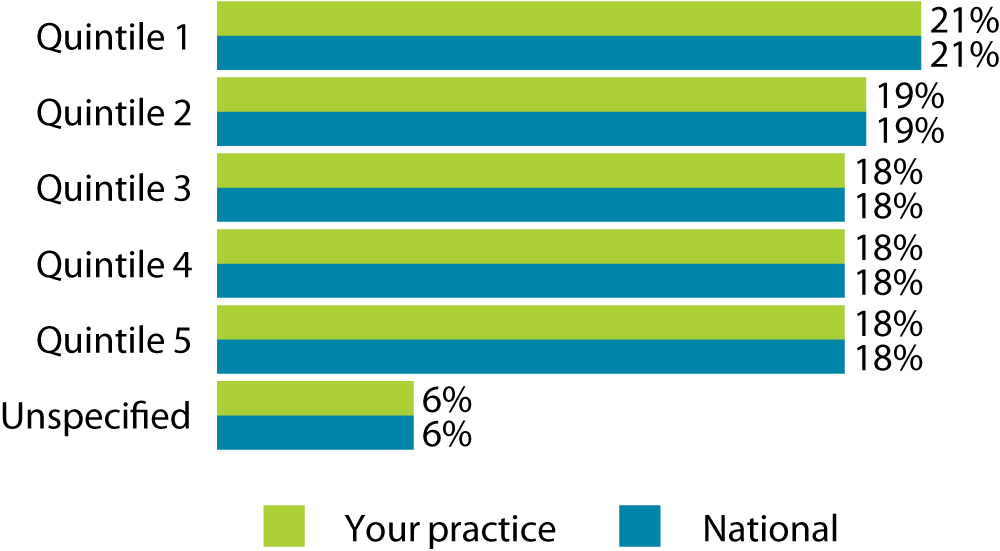
Deprivation quintile
Deprivation quintile is a score representing the level of socio-economic deprivation of the area where the person resides.
Quintile 1 is the least deprived and quintile 5 is the most deprived. If the deprivation quintile is unspecified it is due
to an address that could not be geocoded.
Appendix - Methods & Notes
The data in this report is based on three of the Ministry of Health's National Collections. The collections used in this report contain data provided to Sector Services (formerly HealthPAC) and National Collections and Reporting through the General Transaction Processing System:
- The Pharmaceutical Collection holds claim data submitted by pharmacies for all dispensings of subsidised medicines.
- The Laboratory Claims Collection contains claim data for laboratory tests performed in community laboratories. Laboratory tests performed in hospitals are not included in this collection.
- The Primary Health Organisation Enrolment Collection holds patient enrolment data for 4.25 million patients registered to 1065 New Zealand general practices.
As our data is provided by the Ministry of Health, bpacnz has no control over errors which may occur at the pharmacy, laboratory, Sector Services or Ministry of Health. Some errors may also be due to rounding.
In this report, cost is the standard price at which a medicine is supplied to wholesalers, exclusive of GST, dispensing fees, markup and rebates.
Data has been excluded for patients who are not registered to a practice in the PHO Enrolment Collection. Enrolled patients accounted for 95% of pharmaceutical dispensings and 96% of laboratory investigations recorded in the National Collections. Therefore data has also been excluded when a National Health Index (NHI) number was not recorded for the patient.
This report includes data on dispensed subsidised medicines. Any medicines prescribed to your patients that were not dispensed by a community pharmacy will not appear on this report.
 |
Important Note
Some medicines dispensed and tests requested for your registered patients are likely to have been prescribed by New Zealand
healthcare professionals who do not work at your practice. They are included in this report to provide you with an overall
view of the care received by your registered patients, and will not necessarily be listed if you audit your Practice Management System.
|