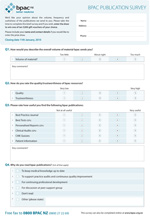
Best Practice Survey Results

Summary of Survey Results
In November 2009 bpacnz surveyed 6700 general practitioners, practice nurses and pharmacists who receive bpacnz material. The purpose of this survey was to seek opinions about the volume, frequency and usefulness of bpacnz publications. Over 2000 people responded and their opinions are set out and summarised in this document.
Volume of material about right
It is good to know that 82% of respondents think that we should have no change to the current volume and frequency of material. Smaller publications, more often were favoured by 11% and larger publications less often favoured by 8%.
15% were leaning towards “too much” and only 3% thought it was nearing “too little.”
Our material is trusted...
Out of a score of 1 to 5 (where 5 is very high), bpacnz resources received an average of 4.5 for quality and 4.2 for trustworthiness.
...and found useful
On average, Best Practice Journal was rated 4.5 out of 5 for usefulness and Best Tests 4.2 out of 5.
GPs rated both personalised reports and clinical audits an average of 3.8 out of 5 for usefulness. Some commented on the frustration of the data not appearing to accurately reflect their clinical practice. We would like to improve on this and will be investigating ways in which we can present data even more usefully.
CME quizzes were rated an average of 3.9 out of 5 and patient information 4.0.
Why are our publications read?
The overwhelming majority of respondents read bpacnz publications to keep their medical knowledge up to date (98%) and for continuing professional development (91%).
No barriers to reading bpacnz publications for most
Most respondents do not have any barriers to reading bpac material. Of those who cited barriers, finding time to read the publications was the most common.
Wish list
We received some great suggestions for products or services that bpac may consider providing in the future, including:
Seminars, CDs, podcasts, electronic newsletters, online peer support group, software for adverse reaction reporting, audit of professional standards, New Zealand formulary, pharmacist and nurse versions of BPJ, complementary medicine section, case scenarios, downloadable patient resources, query service for medical questions.
Survey respondents representative of General Practice
Of the 6704 surveys bpacnz sent out to general practitioners, practice nurses and pharmacists, 2041 responses were received. Although the survey was anonymous only 105 respondents chose not to provide their names and addresses.
Table 1: Response rate by respondent type| Number received |
Number sent | % received | |
| GP | 1216 | 3938 | 30.9% |
| Nurse | 507 | 1693 | 29.9% |
| Pharmacist | 213 | 1073 | 19.9% |
| Unknown | 105 | ||
| Total | 2041 | 6704 | 30.4% |
| A comparison of prescription volumes between survey respondents and non-respondents showed a similar pattern. This suggests the respondents are representative of New Zealand GPs in terms of prescribing behaviour. |
| The geographic distribution of GPs who responded to the survey reflects the national geographic distribution of all GPs |
| Page Intro | Q1 | Q2 | Q3 | Q4 | Q5 | Q6 | Q7 | Q8 | Q9 | Page 0 |